Talking LED
I’m working with a Raspberry Pi for a project. For my “Hello World”
project, Raspberry Pi edition, I set up a LED and programmed it to
blink. For a part of the main project, I had the Raspberry Pi read
words in the lovely robot voice of espeak.
I thought what so many people before me have: Can I put these two together? Can I make that little LED blink with the words?
Totally
The files are generated using Linux’s text-to-speech program,
espeak. Something like this:
echo "This American Life" | espeak -w tal.wavI want to blink a LED along with the audio.
The first issue is splitting the audio output between the speakers and my light-blinking program.
Note to self, the tee command is cool
My first idea involved tee, a nifty UNIX command that I never
remember when I need it, but do remember when I don’t.
tee can be used to split a command’s output into two outputs. In
this context, I could use tee to send espeak’s data to both aplay
and my visualizer.
But since I can compute the visuals faster than the audio plays, and
tee would send the file all at once to both aplay and the
visualizer, the audio and visuals would be out of sync. Uncool!
PyAudio
At this point, I searched for prior work on the internet (a benefit of
being unoriginal!) It led me to a strategy involving Python’s built-in
wave, which can read
WAV files, and
PyAudio, which can
play audio through Python. PyAudio provided a nice
starter script on its
site, that provided most of the code for this project.
The basic strategy is:
- Read a part of the WAV file using
wave. - Process that data to determine how bright to make the LED.
- Update the brightness of the LED.
- Pass the data to PyAudio to play.
Or in code, the gist is (based on that lovely starter script)
CHUNK = 1024
wf = wave.open(...)  # WAV file
stream = ...  # Set up PyAudio's output stream

data = wf.readframes(CHUNK)  # Read a part of the WAV file
while data != '':
    do_something_with_the_light(data)  # Make the LED do something
    stream.write(data)  # Play it (blocking)
    data = wf.readframes(CHUNK)  # Read the next part of the file
An aside: Chunk size
If the CHUNK number is too small, the inside of the while loop takes
longer than the sound part I read, and it sounds gross and choppy. If
the CHUNK number is too big, I get fewer points where the visuals
and audio are in sync.
Do something with the light
I found an example online that converted the data from wave into a
numpy array.
data = wf.readframes(CHUNK)
...
def do_something_with_the_light(data):
    array = np.fromstring(data, dtype=width)
    ...
And now I had numbers!
Meaningless numbers
I got this far without having to remember or learn anything about signals or audio. Now I had this meaningless array of numbers, which I wasn’t even sure if I had decoded properly. I took a step back and learned a few things.
I started by trying to make sense of PyAudio stream initialization arguments, format and rate.
stream = p.open(format=p.get_format_from_width(wf.getsampwidth()),  # ???
                channels=wf.getnchannels(),  # mono or stereo
                rate=wf.getframerate(),  # ???
                output=True)
Recall physics, and then digitize it
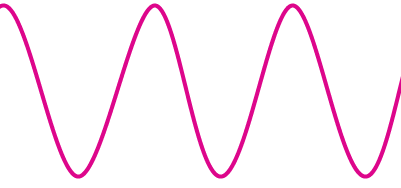
Sound is a vibration and can be represented by a waveform. In one version, the x-axis is time. The amplitude of the wave is how loud it is. I need some way to measure this to determine how bright to make the LED.
Artist’s interpretation of sine wave:

WAV files use a bitstream to represent a waveform. A bitstream is, uh,
a stream of bits, like 01010010. WAV uses a strategy to represent
the wiggly waves in bits, and I want to turn it back into a waveform
in order to access its amplitude.
Part 1: Frames, a sample of an amplitude
One way to represent audio signals is pulse-code modulation, where you sample the value of the amplitude at uniform intervals. I imagine it as something like this:
![]()
There’s only one highlighted point per column, and the point might be
rounded up or down (I think this is quantization). Then I can
represent this whole waveform in a list of numbers, like
[4, 1, 0, 2, 6, 7, 4, 1, 0, 2, 6, 7, 4, 1, 0, 2]
In Python’s wave, each amplitude sample, like 4, is called a frame.
In the code, wf.readframes(1024) gives me the amplitude of
1,024 samples. For my project, I want to average the amplitudes of
these samples to determine the brightness. So close!
First though, I need to make sense of the raw data of
wf.readframes(1024).
Part 2: Sample width, how each sample is represented
Pulse-code modulation WAV represents waves as a list of numbers in
a stream of bits. The amplitude samples above looked like
[4, 1, 0, 2, 6, 7, ...].
Let’s say I want to send you these numbers as a bitstream. First, I’d
change [4, 1, 0, 2, 6, 7, ...] to bits, like 100 001 000 010 110 111, and I’d
ditch the spaces and get something like 100001000010110111.
When you start getting the stream of bits, 100001000010110111, you’d want to
know if you should read it as
100001000 010110111 or
100 001 000 010 110 111 or something else.
So I’d tell you ahead of time that each number
is represented by 3 bits. Similarly in wave, wf.getsampwidth() tells me the sample width in bytes.
To be honest, I still don’t completely understand this part, because I’m not sure what those bytes represented. Are they signed, unsigned, or a float? Is this noted in the file, or in the specification? Instead of looking into it too much, I peaked at how PyAudio did it.
PyAudio also needs to know this information to build its stream. In
the demo code, it uses p.get_format_from_width(wf.getsampwidth()) to
get a PortAudio format,
like pyaudio.paInt16. I cheated a bit, and added a mapping based on this:
if pyaudio_format == pyaudio.paInt16:
    width = np.int16
else:
    sys.exit("add a mapping from this pyaudio format to numpy type")
...
np.fromstring(data, dtype=width)
Part 3 (bonus): Rate, or how wide the uniform intervals are
At this point, I actually know enough to make my light blink. But for completeness, let’s talk about rate.
In Part 1, I got a list of amplitude measurements across 1,024 points. WAV doesn’t store the x-values of all these points. Instead, it notes the number of samples per second, or how wide those uniform intervals are.
wave gives the number of samples per second with wf.getframerate(). My file was 22050.
Empowered with knowledge, onward I go!
Back to my function:
def do_something_with_the_light(chunk_data):
  data = np.fromstring(chunk_data, dtype=width)
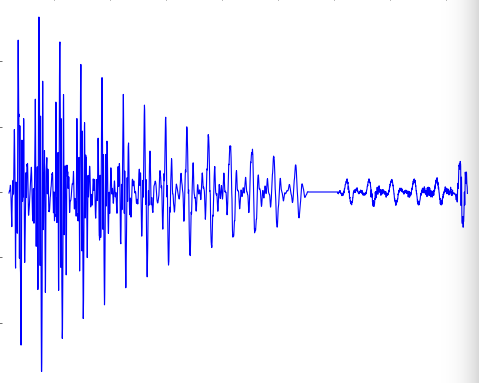
Now I knew what data I was getting. It represented the sound with 1,024 int16 numbers that represented the amplitude of the waveform. In the real world, it represented approximately 1/20th (or 1024/22050) of a second of sound.
So I should be able to graph it!

Neat!
The last step is turning that wiggly line into how bright the LED should be when playing this sound bite. A higher amplitude means the sound was louder. I’m sure I could spend a lot of time on this (how do humans perceive differences in loudness and brightness?), but instead, I took the mean of the absolute value and scaled it to a percent for the LED.
And it kind of looked okay! The light blinked along with the sound!
And I learned a tiny, tiny bit about audio file formats.
See Also
- The code
- PyAudio and PortAudio
- This is a more legit: 3D Spectrum Analyser
- Speaking of codecs, here’s a cool post about H.264